


About Mussoorie
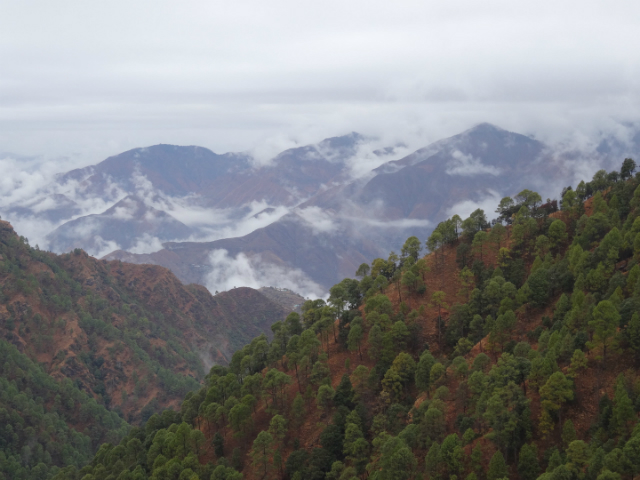
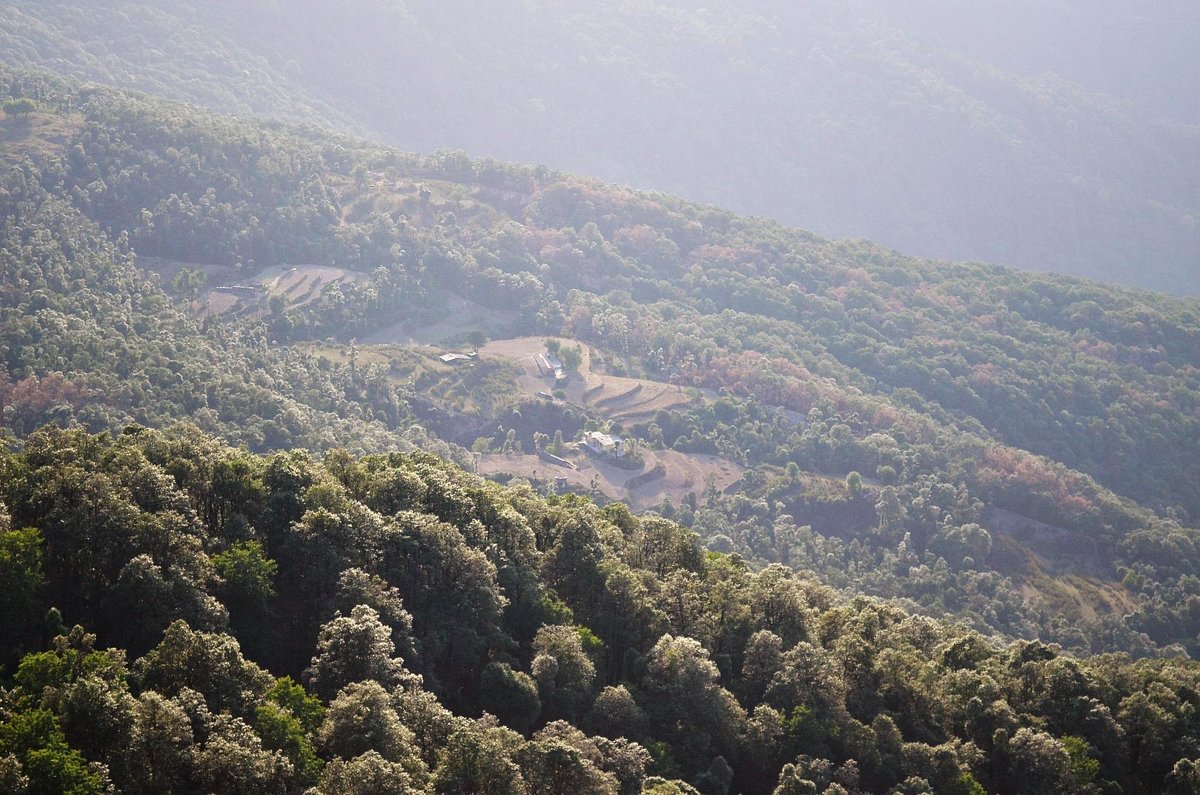
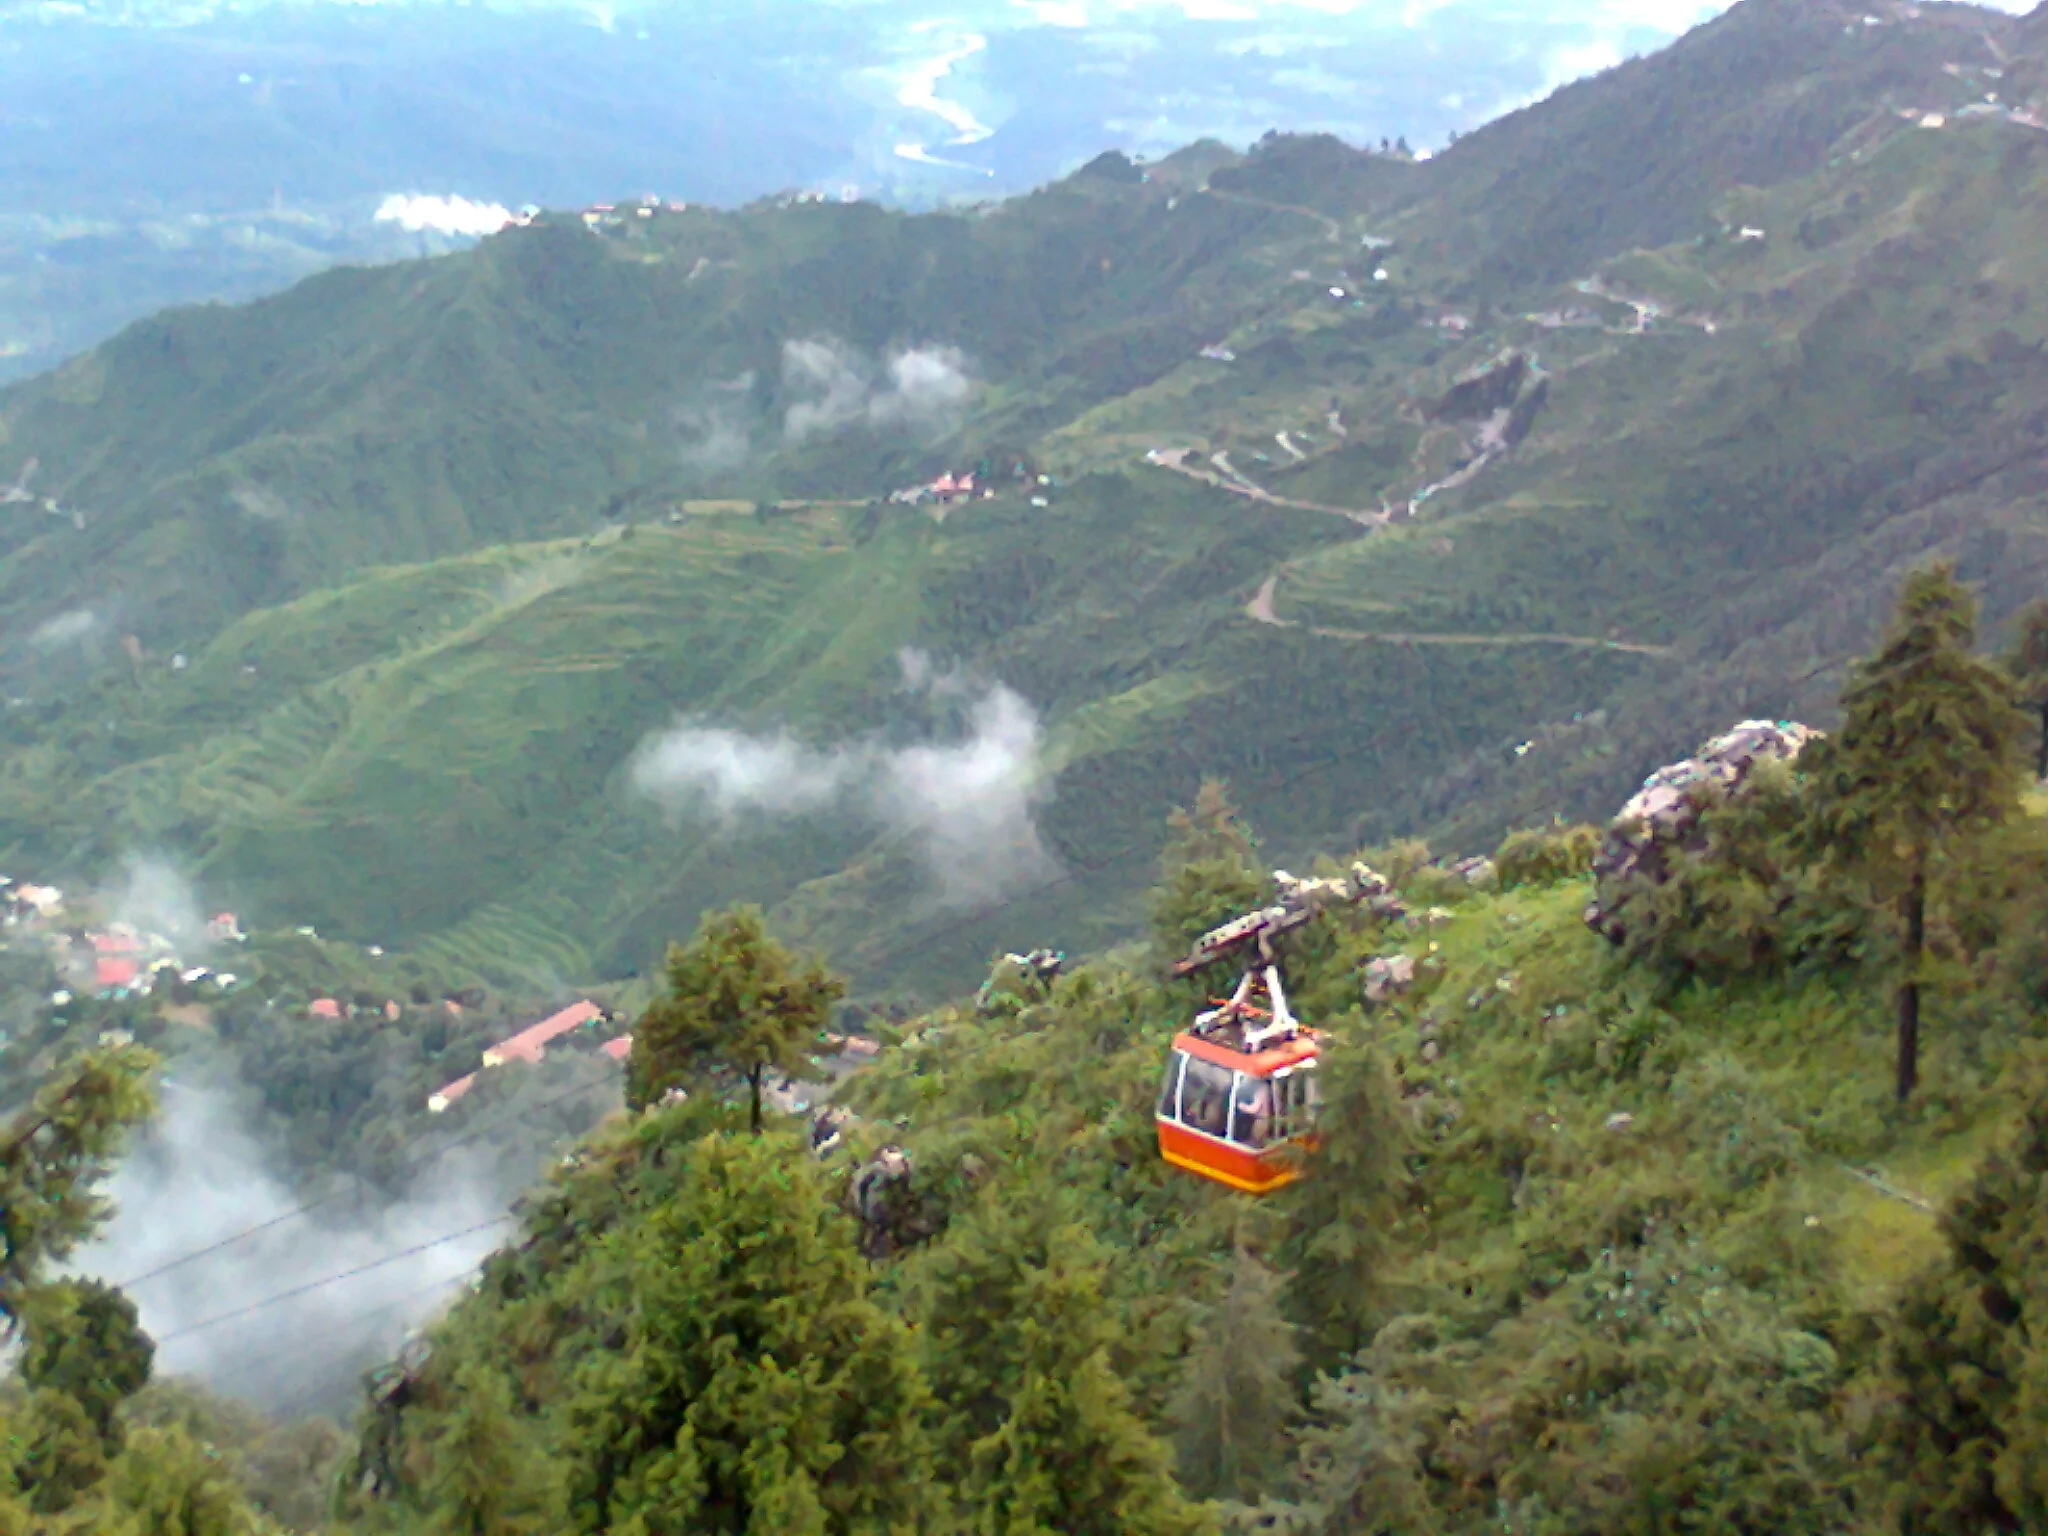
Mussoorie has an average elevation of about 2,005 metres (6,578 ft). The highest point is "Lal Tibba", at a height of about 2,275 m (7,464 ft), although the name Lal Tibba is now also used to describe a lookout point, a short distance from the peak.
Mussoorie has a fairly typical subtropical highland climate (Köppen Cwb) for the mid-altitude Himalaya. Summers are warm and very wet, with July and August averaging approximately 660 millimetres (26 in) of rain per month due to orographic lift of the extremely moist monsoonal air. The pre-monsoon seasons in April and May is warm and generally dry and clear, giving way to heavy rainfall from mid-June, while the post-monsoon season is also dry and clear but substantially cooler. In winter, rainfall is a little more frequent than in the pre-and post-monsoon seasons, and the general weather cool and partly cloudy. Mussoorie usually receives a few spells of snowfall in December, January and February, although the number of snowy days has come down in recent years due to a combination of local and global factors, such as deforestation, construction activity and global warming.[citation needed] Between October to February the town shows the rare "winterline" phenomenon.
| hideClimate data for Mussoorie (1971-2000, extremes 1901-1987) | |||||||||||||
|---|---|---|---|---|---|---|---|---|---|---|---|---|---|
| Month | Jan | Feb | Mar | Apr | May | Jun | Jul | Aug | Sep | Oct | Nov | Dec | Year |
| Record high °C (°F) | 21.1 (70.0) |
23.3 (73.9) |
26.1 (79.0) |
29.1 (84.4) |
34.4 (93.9) |
31.7 (89.1) |
29.4 (84.9) |
25.6 (78.1) |
27.2 (81.0) |
28.1 (82.6) |
25.0 (77.0) |
23.3 (73.9) |
34.4 (93.9) |
| Average high °C (°F) | 10.3 (50.5) |
11.2 (52.2) |
15.7 (60.3) |
20.6 (69.1) |
23.0 (73.4) |
23.2 (73.8) |
20.9 (69.6) |
20.5 (68.9) |
19.8 (67.6) |
18.6 (65.5) |
15.5 (59.9) |
12.7 (54.9) |
17.6 (63.7) |
| Average low °C (°F) | 2.8 (37.0) |
3.4 (38.1) |
7.1 (44.8) |
11.5 (52.7) |
14.3 (57.7) |
15.6 (60.1) |
15.0 (59.0) |
14.8 (58.6) |
13.6 (56.5) |
11.1 (52.0) |
7.6 (45.7) |
4.5 (40.1) |
10.0 (50.0) |
| Record low °C (°F) | −5.0 (23.0) |
−6.7 (19.9) |
−2.5 (27.5) |
−1.5 (29.3) |
3.7 (38.7) |
4.1 (39.4) |
11.7 (53.1) |
7.4 (45.3) |
1.3 (34.3) |
2.6 (36.7) |
−2.1 (28.2) |
−3.9 (25.0) |
−6.7 (19.9) |
| Average rainfall mm (inches) | 49.9 (1.96) |
65.2 (2.57) |
73.1 (2.88) |
56.2 (2.21) |
69.0 (2.72) |
200.9 (7.91) |
629.6 (24.79) |
548.0 (21.57) |
264.5 (10.41) |
55.5 (2.19) |
14.9 (0.59) |
10.1 (0.40) |
2,036.8 (80.19) |
| Average rainy days | 4.1 | 5.0 | 5.1 | 3.8 | 5.0 | 9.5 | 22.4 | 21.3 | 11.6 | 2.7 | 0.9 | 1.3 | 92.7 |
| Average relative humidity (%) (at 17:30 IST) | 78 | 75 | 66 | 56 | 58 | 70 | 85 | 87 | 85 | 78 | 75 | 75 | 74 |
| Source: India Meteorological Department[17][18] | |||||||||||||
Leave a Reply